A picture's worth 1000 words, so without further ado, here's a 3 month daily candlestick chart of the New York Stock Exchange Composite Index ($NYSE) thru part of this morning's price action:

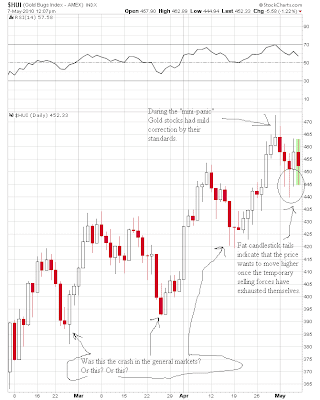
Round trip to nowhere, eh? Next up, a 3 month chart of Gold stocks using the Gold Bugs Index ($HUI) as a proxy:

The relative strength of Gold stocks has been outstanding despite their fairly weak performance relative to the price of Gold. I believe this is telegraphing another cyclical Gold stock bull market during the pending cyclical general stock bear market. We shall see...